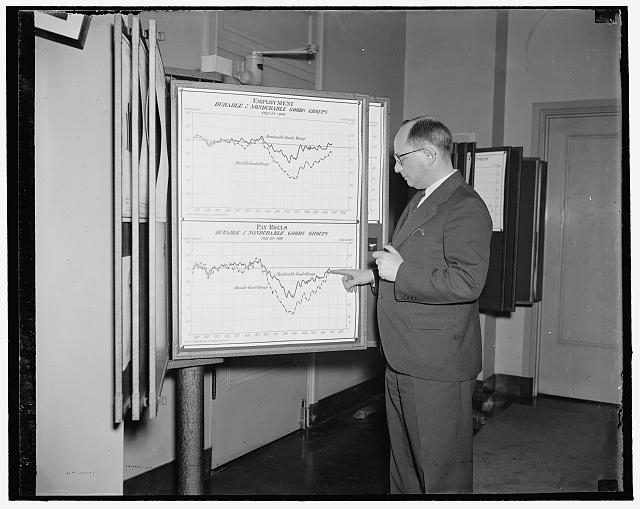
Map depicts significant story on pickup in American...
Map depicts significant story on pickup in American industry. Washington, D.C. March 30. Tow lines on this chart hanging in the office of Isador Lubin, Commissioner of Labor Statistics, U.S. Department of Labor, tell a significant story of the pickup in American Industry since 1933. Mr. Lubin points to line no. 1 which represents the consumers or nondurable goods industries (food, clothing, etc.) it began to climb in 1933 and has been on the upgrade ever since. Line no. 2 represents durable goods or heavy industry (steel building materials, machinery). It was hardest hit by the depression, lagged far behind even during most of 1936. But line no. 2 is going almost straight up. By March 1, it has attained a level almost parallel with consumers goods. This means that for the first time since 1929, payrolls in vital heavy industries are once again in a normal relation to payrolls in the consumer industries.
Historic and vintage photographs contained in the United States Library of Congress.
The U.S. Library of Congress is the oldest and largest library in the United States, second in the world only to The British Library. Established on April 24th, 1800 the Library of Congress includes ...
U.S. Great Depression photos from the 1930's - 1940's
Did you know that the Great Depression was worldwide but began in the United States with the crash of the stock market on October 29, 1929 (Black Tuesday)? As a result of the Depression, unemployment ...
This account is shared by Community Support (Kathy Pinna & Daniel Pinna & Lizzie Kunde) so we can quickly answer any questions you might have.
Please reach out and message us here if you have any questions, feedback, requests to merge biographies, or just want to say hi! 2020 marks 20 years since the inception of AncientFaces. We are the same team who began this community so long ago. Over the years it feels, at least to us, that our family has expanded to include so many. Thank you!